inspectIT Ocelot Demo Application
inspectIT Ocelot Demo
If you would like to check inspectIT Ocelot in action with a demo application, you can use our docker compose example. We use the distributed version of the Spring PetClinic sample application as the target application in our demo. To demonstrate the flexibility of the OpenCensus bases inspectIT agent, we provide different demo scenarios covering different monitoring and APM components.
All of the demo scenarios are fully configured with predefined dashboards, so you can get started in 5 minutes.
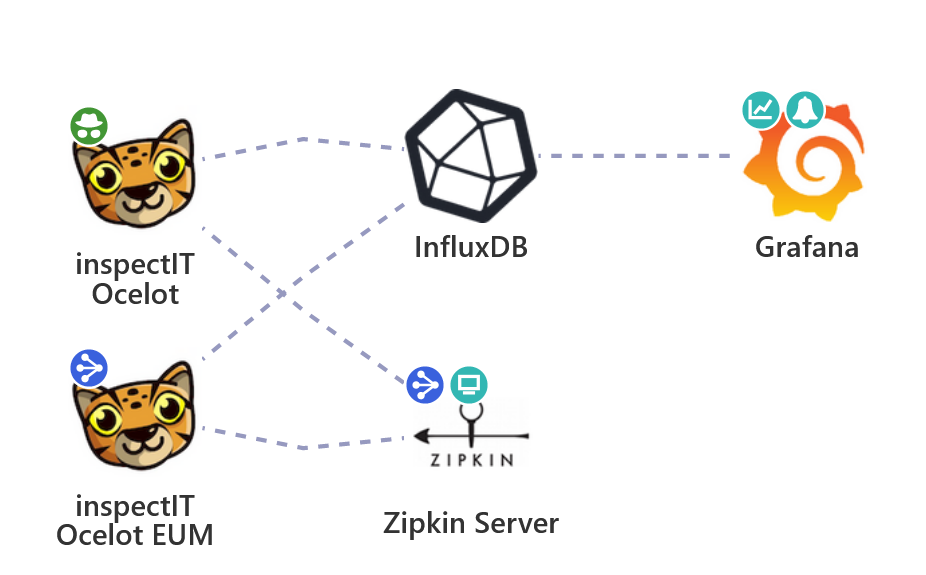
Demo #1 - InfluxDB and Zipkin
Uses InfluxData Telegraf for metrics gathering, InfluxDB for metrics storage and Grafana for Dashboards. Traces are exported to Zipkin. See section below for detailed information.
- File:
docker-compose-influxdb-zipkin.yml - OpenAPM Landscape
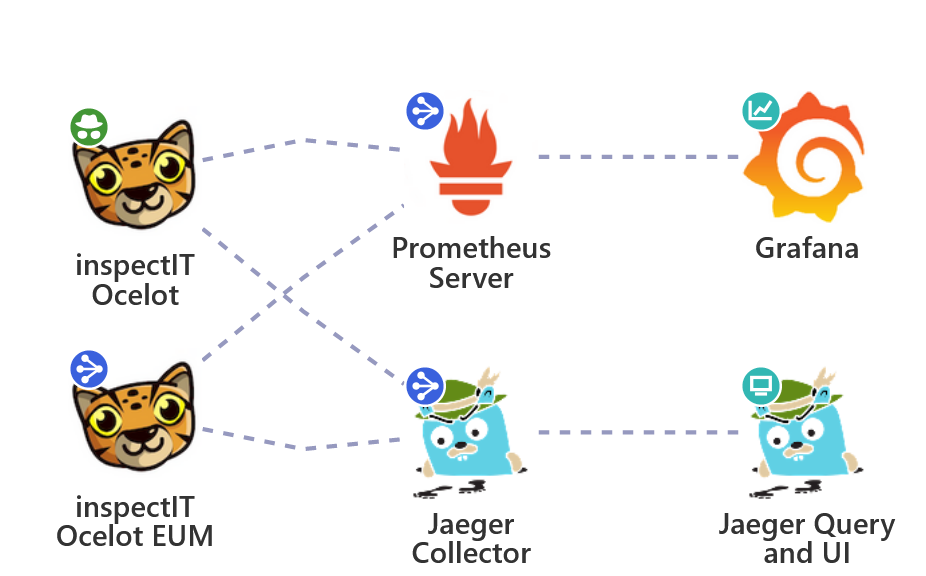
Demo #2 - Prometheus, Grafana and Jaeger
Uses Prometheus Server for metrics gathering and storage, Grafana for Dashboards. Traces are exported to Jaeger. See section below for detailed information.
- File:
docker-compose-prometheus-jaeger.yml - OpenAPM Landscape
Demo #3 - Wavefront and Zipkin
Sends Zipkin traces to Wavefront through a Wavefront proxy running as a Docker container. Collects metrics via Telegraf and sends them to Wavefront. See section below for detailed information.
- File:
docker-compose-wavefront-zipkin.yml
Note: Before running the demo, you must add the Wavefront host and API token to the
.envfile in theinspectit-ocelot-demo. Please add the following lines and change the cluster and token according to your Wavefront instance.WAVEFRONT_URL=https://<your cluster>.wavefront.com/api WAVEFRONT_TOKEN=<API token obtained from Wavefront>
Launching the Demo
Pre-requisites: To launch the demo, Docker needs to be installed on your system. If you are using Docker for Windows or running Docker in a virtual machine, ensure that Docker has at least 4GB main memory assigned.
Either download or clone the inspectit-Ocelot GitHub repository.
Change into the inspectit-ocelot-demo/ directory and execute the following command to launch the desired demo scenario (replace [SCENARIO_POSTFIX] with the postfix of the scenario you would like to launch):
$ docker-compose -f docker-compose-[SCENARIO_POSTFIX].yml up
This will start all the Docker containers required for the corresponding demo scenario, including the Petclinic demo application.
You can access the demo application (PetClinic) under http://localhost:8080. Details on accessing monitoring infrastructure components are listed below, depending on the selected demo scenario.
Starting the Demo on Windows Using WSL
If you want to execute the demo on Windows using the Windows subsystem for linux (WSL), you have to mount your hard drive to the WSL's root directory due to a problem of Docker for Windows and its volume mounting.
For example, mounting your C drive to the root file system can be achieved using the following commands:
sudo mkdir /c
sudo mount --bind /mnt/c /c
For more information, check out the following blog post: Setting Up Docker for Windows and WSL to Work Flawlessly
Demo Scenarios
In all scenarios you can use
adminas username anddemoas password for accessing Grafana and the inspectIT Ocelot Configuration Server.
InfluxDB and Zipkin Scenario
In this scenario the following components are preconfigured and used for monitoring:
- inspectIT Ocelot agent: Instruments all the target demo application components.
- InfluxData Telegraf: Gathers metrics exposed by the agent.
- InfluxDB: Stores metric data collected by Telegraf as time series.
- Grafana: Provides predefined example Dashboards visualizing the metrics collected by the inspectIT Ocelot agent. The query language Flux is used to query the data from InfluxDB.
- Zipkin: Zipkin is used to store and query all recorded traces.
You can access Grafana through http://localhost:3001 and the configuration server via http://localhost:8090. The traces can be viewed in Zipkin on http://localhost:9411.
Prometheus and Jaeger Scenario
In this scenario the following components are preconfigured and used for monitoring:
- inspectIT Ocelot agent: Instruments all the target demo application components.
- Prometheus Server: Gathers metrics exposed by the agent.
- Grafana: Provides predefined example Dashboards visualizing the metrics collected by the inspectIT Ocelot agent.
- Jaeger: Jaeger is used to store and query all recorded traces.
You can access Grafana through http://localhost:3001 and the configuration server via http://localhost:8090. The traces can be viewed in Jaeger on http://localhost:16686.
Prometheus can be accessed through http://localhost:9090.
Wavefront Demo Scenario
Wavefront is a SaaS-based monitoring and tracing solution. In this demo, we are running a local proxy as a Docker container that is responsible for receiving Zipkin traces and sending them to Wavefront. We're also using Telegraf to poll the Prometheus endpoints on the monitored services and send that data to Wavefront through the proxy.
- inspectIT Ocelot agent: Instruments all the target demo application components.
- Telegraf: Polls the Prometheus metric endpoints on the services.
- Wavefront Proxy: Receives Zipkin traces and metrics (via Telegraf), aggregates, secures and compresses them before sending them to Wavefront.
A sandbox instance of Wavefront can be obtained here: https://www.wavefront.com/sign-up/
The inspectIT Ocelot Configuration Server can be accessed via http://localhost:8090.
Demo Grafana Dashboards
The InfluxDB and Prometheus demo scenarios include the following predefined Grafana Dashboards:
| Name + Grafana Marketplace | Description | Screenshot |
|---|---|---|
| Service Graph [InfluxDB] [Prometheus] | Shows a graph of all instrumented and external services and their interaction. All flows are derived based on live metrics. |  |
| HTTP Metrics [InfluxDB] [Prometheus] | Shows statistics of incoming and outgoing HTTP requests for each instrumented service. |  |
| System Metrics [InfluxDB] [Prometheus] | Shows system metrics, such as system CPU utilization, load average and disk usage. | 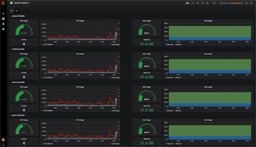 |
| JVM Metrics [InfluxDB] [Prometheus] | Shows JVM metrics related to JVM CPU usage, Memory (Heap and Non-Heap) and Garbage Collection. | 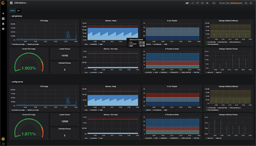 |
| Self Monitoring [InfluxDB] [Prometheus] | Shows the instrumentation state and progress based on self monitoring metrics. | 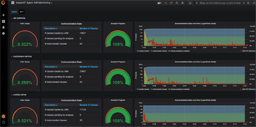 |
Changing Agent Configurations
In all demo scenarios the inspectIT Ocelot agents already have their service names and used ports as well as a basic instrumentation set up. Each scenario uses the inspectIT Ocelot Configuration Server for managing and providing the configuration files to the agents. The web UI of the configuration server can be accessed via localhost:8090.
The demo starts the following services, of which each is instrumented with an inspectIT Ocelot Agent:
- config-server
- discovery-server
- customers-service
- visits-service
- vets-service
- api-gateway
